
Plan a project
You’ll create a small project, type its tasks as an outline, nest them into phases with Tab, give them durations and dates, add a milestone and a dependency, and watch it all appear on the Gantt timeline. About 15 minutes.
What you’ll need
Section titled “What you’ll need”- Ensō open in your browser or the desktop app, signed in
- Something to plan — we’ll use a website launch, but any few-week effort works
1. Create the project
Section titled “1. Create the project”- Open Projects (Ctrl+Space,
p, Enter). - At the bottom of the left sidebar, click New project…, type
Website launch, and press Enter.
The project opens with an empty outline. On wide screens the header reminds you: Tab indents · Shift+Tab dedents · Enter adds a row.
2. Type the first tasks
Section titled “2. Type the first tasks”- Click + Add task below the grid. A blank row appears with the Task name cell ready to type in.
- Type
Designand press Enter. A new row opens directly below. - Keep going, one per line:
Wireframes,Visual design,Build,Homepage,Contact form,Launch.
3. Indent to build the work breakdown
Section titled “3. Indent to build the work breakdown”- Click the Wireframes row (click the name, don’t double-click) and press Tab. It becomes a child of Design.
- Do the same for Visual design.
- Indent Homepage and Contact form under Build.
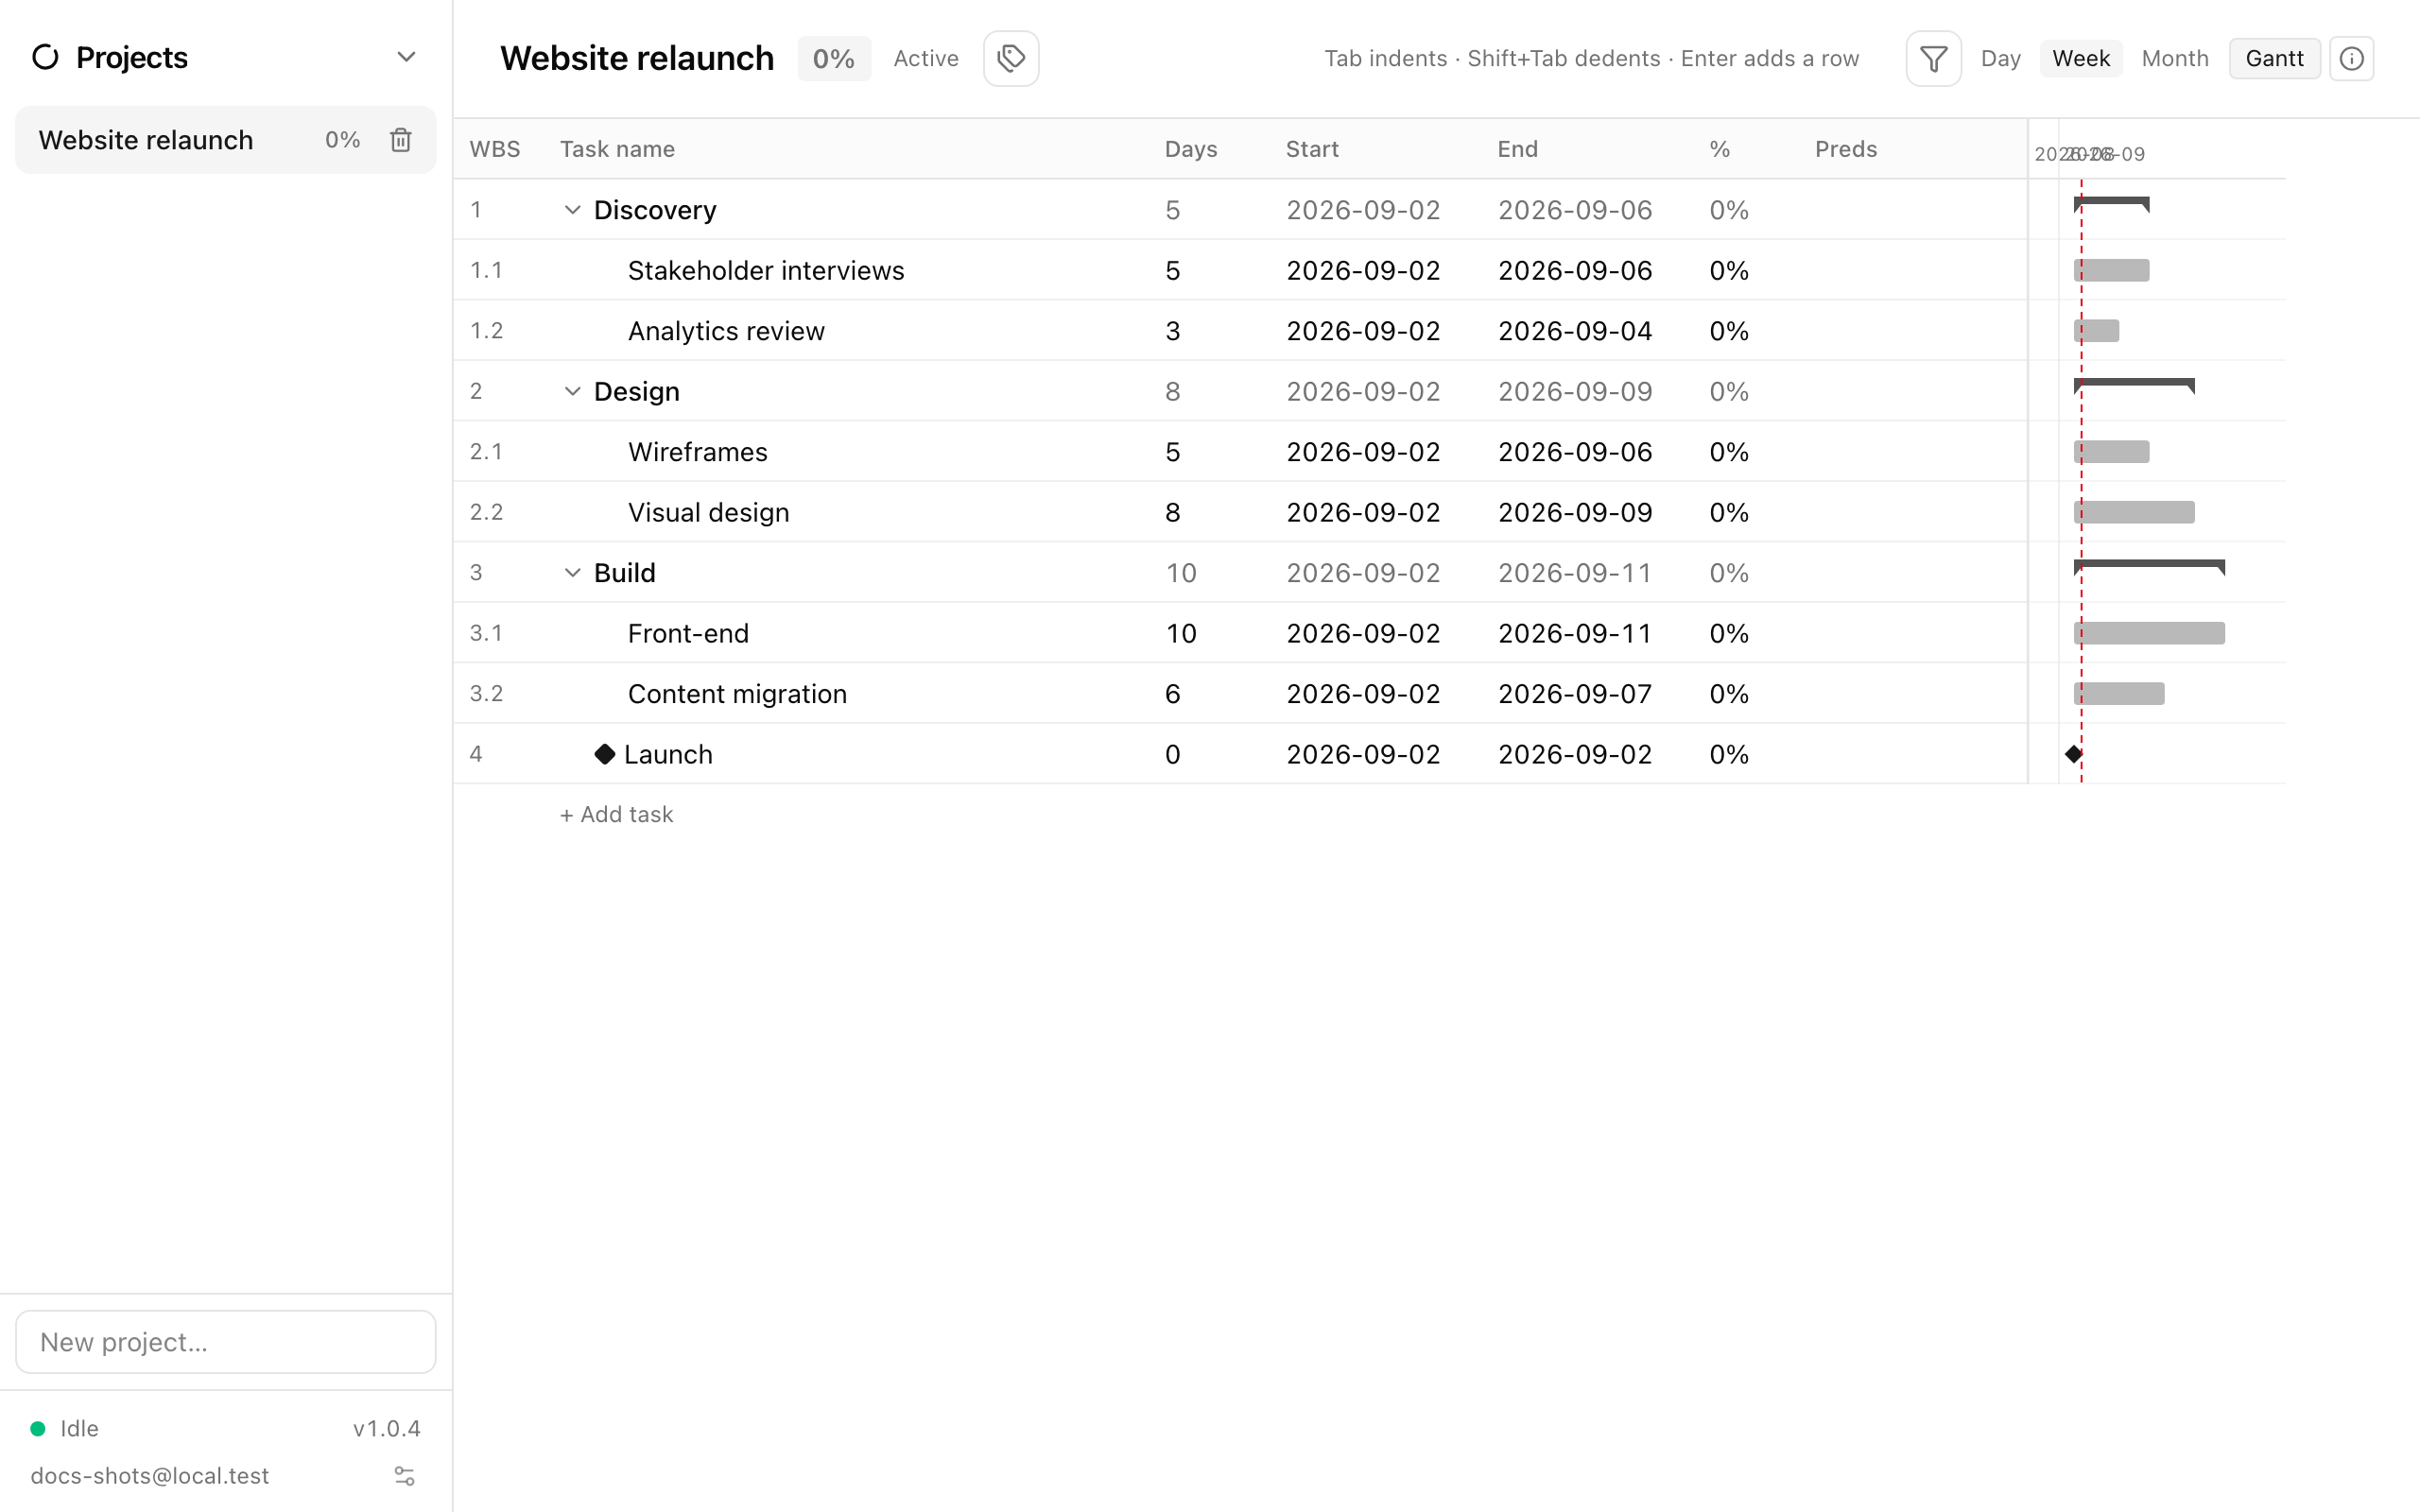
The WBS column renumbers itself: 1, 1.1, 1.2, 2, 2.1, 2.2, 3. Design and Build are now summary rows — their Days, Start, End and % are greyed out because they roll up from their children. Shift+Tab outdents if you overshoot; you can also drag rows (drop in the middle of a row to nest, at its top or bottom edge to reorder).
4. Set durations and dates
Section titled “4. Set durations and dates”Cells edit when you double-click them, press Enter or F2, or just start typing.
- On Wireframes, type
5in Days and press Enter. Duration is a plain number of calendar days — no units. With no dates yet, the task is anchored to today and its End is filled in. - In Start, type a date as
YYYY-MM-DD, for example2026-09-07. The bar slides and keeps its 5 days. - Give Visual design
5days, Homepage8, Contact form3.
Watch the Design and Build summary rows: their Start is the earliest child start, End the latest child end, and % a duration-weighted average of the children.
5. Add a milestone
Section titled “5. Add a milestone”- On the Launch row, type
0in Days.
Zero days is the milestone gesture: the row gets a diamond icon beside its name and shows as a diamond on the Gantt. Type a Start date to place it. Typing a duration of 1 or more turns it back into a normal task.
6. Add a dependency
Section titled “6. Add a dependency”Predecessors are entered by WBS number in the Preds column.
- On Visual design (WBS
1.2), type1.1in Preds and press Enter — it now follows Wireframes. - On Homepage (
2.1), type1.2+2d— follow Visual design with a two-day gap. Separate several with commas, e.g.1.2, 2.1-1d.
Links are advisory: they don’t move dates for you. When a predecessor’s end suggests a later start than the one you typed, an amber →MM-DD marker appears in the Start cell — hover it for Predecessors suggest …. (One exception: linking to a task that has no start date yet fills in the suggested start.)
Click the ⓘ Task info button in the header to open a side panel for the selected row: its Days / Start / End / Complete, any Suggested start, clickable Predecessors and Successors, and a Notes box (What’s left, what you’re waiting on…).
7. Track progress
Section titled “7. Track progress”Type a number into % as work gets done — 100 turns the row green and strikes it through. For a task you’ve decided not to do, type n/a (or right-click → Mark n/a): it stays on the list but stops counting toward the parent’s span and percentage. The project’s overall percentage shows next to its name in the sidebar.
8. Read the Gantt
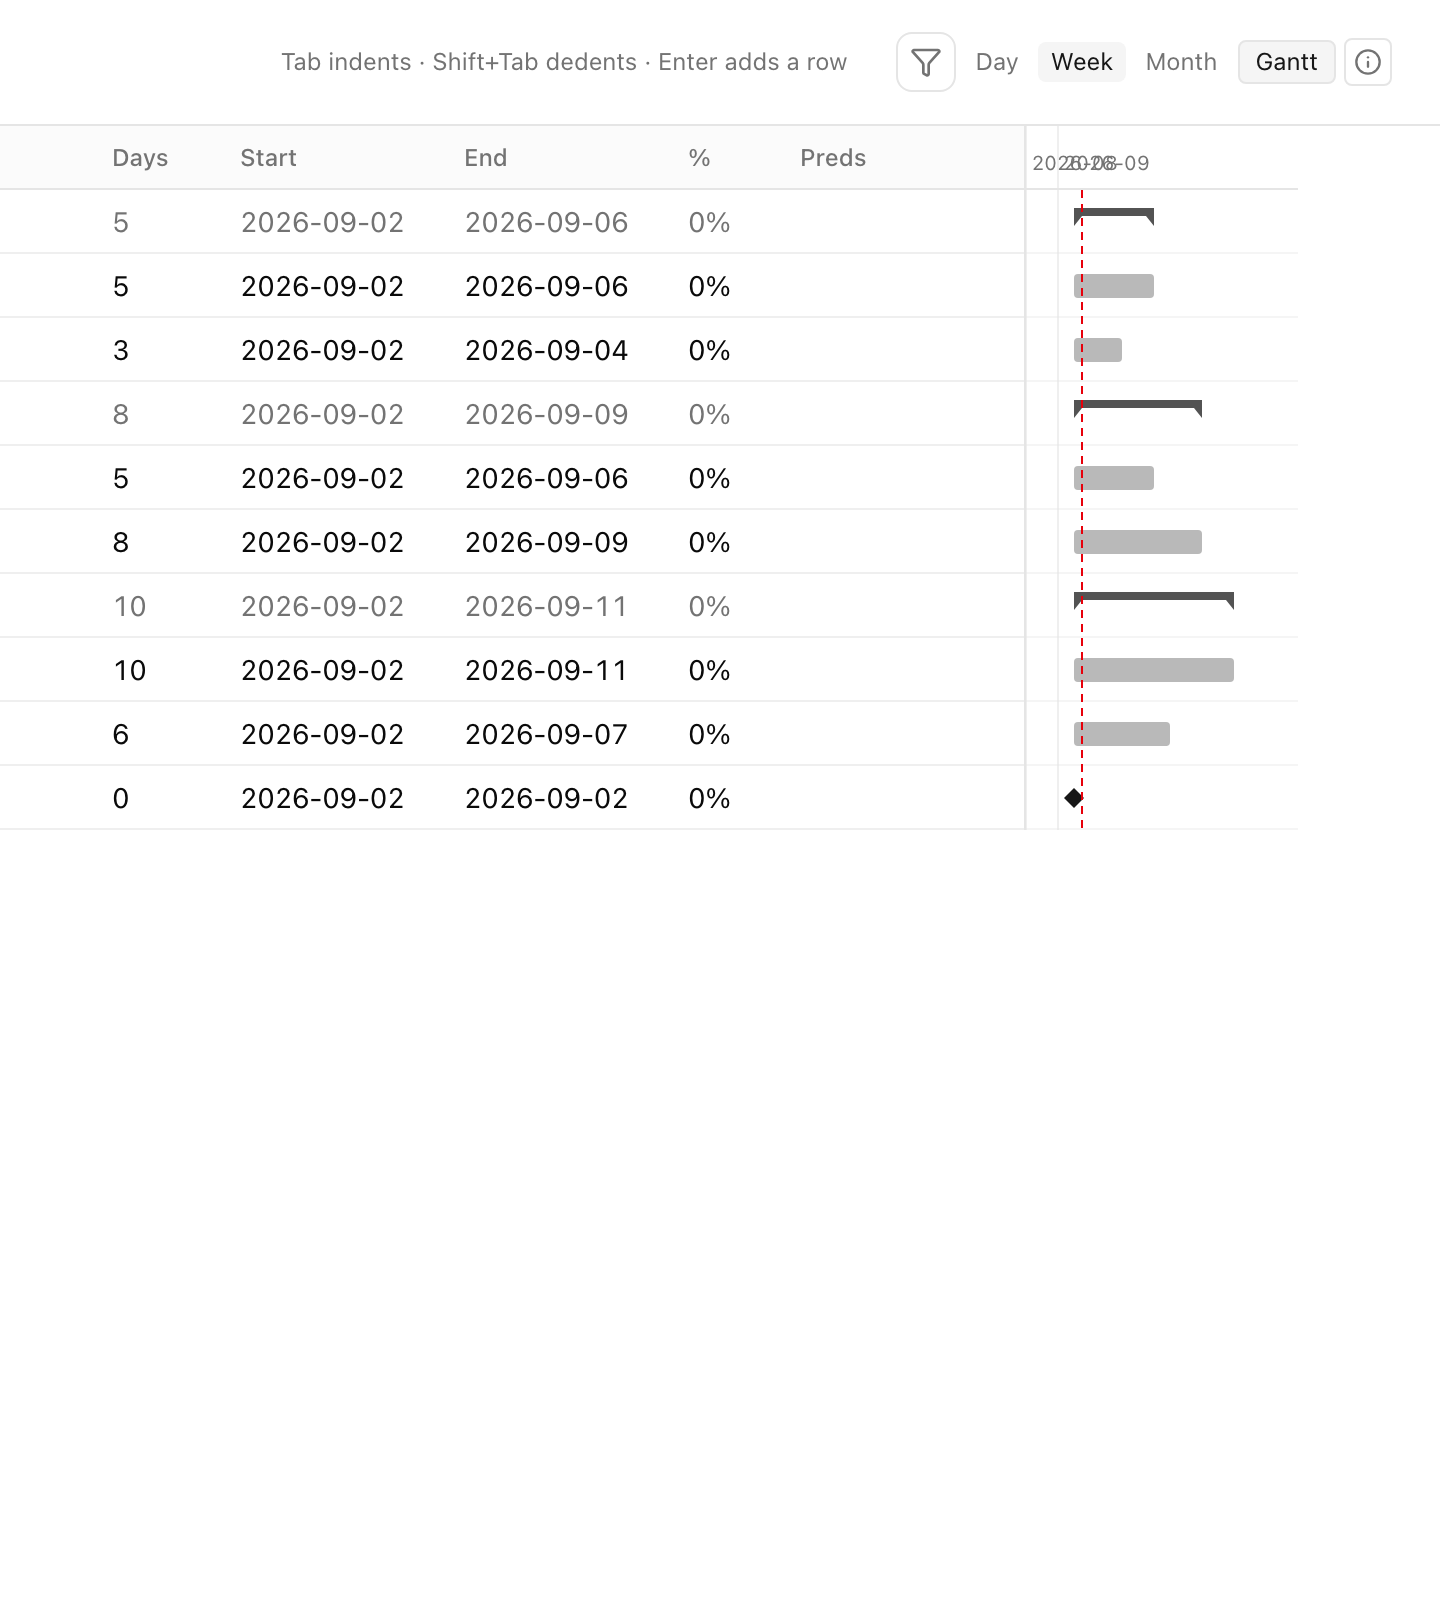
Section titled “8. Read the Gantt”The Gantt button in the header toggles the timeline to the right of the grid (it’s on by default). Rows line up with the outline and scroll together.
- Leaf tasks are bars, filled in proportion to their %.
- Summary rows are thin brackets spanning their children.
- Milestones are diamonds; n/a rows are grey ghosts.
- A dashed red line marks today.
Switch the scale with Day / Week / Month. Month boundaries are labelled; at Day zoom, Mondays get a date label too.
Where next
Section titled “Where next”- Projects — every column, shortcut, and the copy/paste format
- Tags and filters — tag projects and narrow the view
- Set up a vault if the plan is confidential